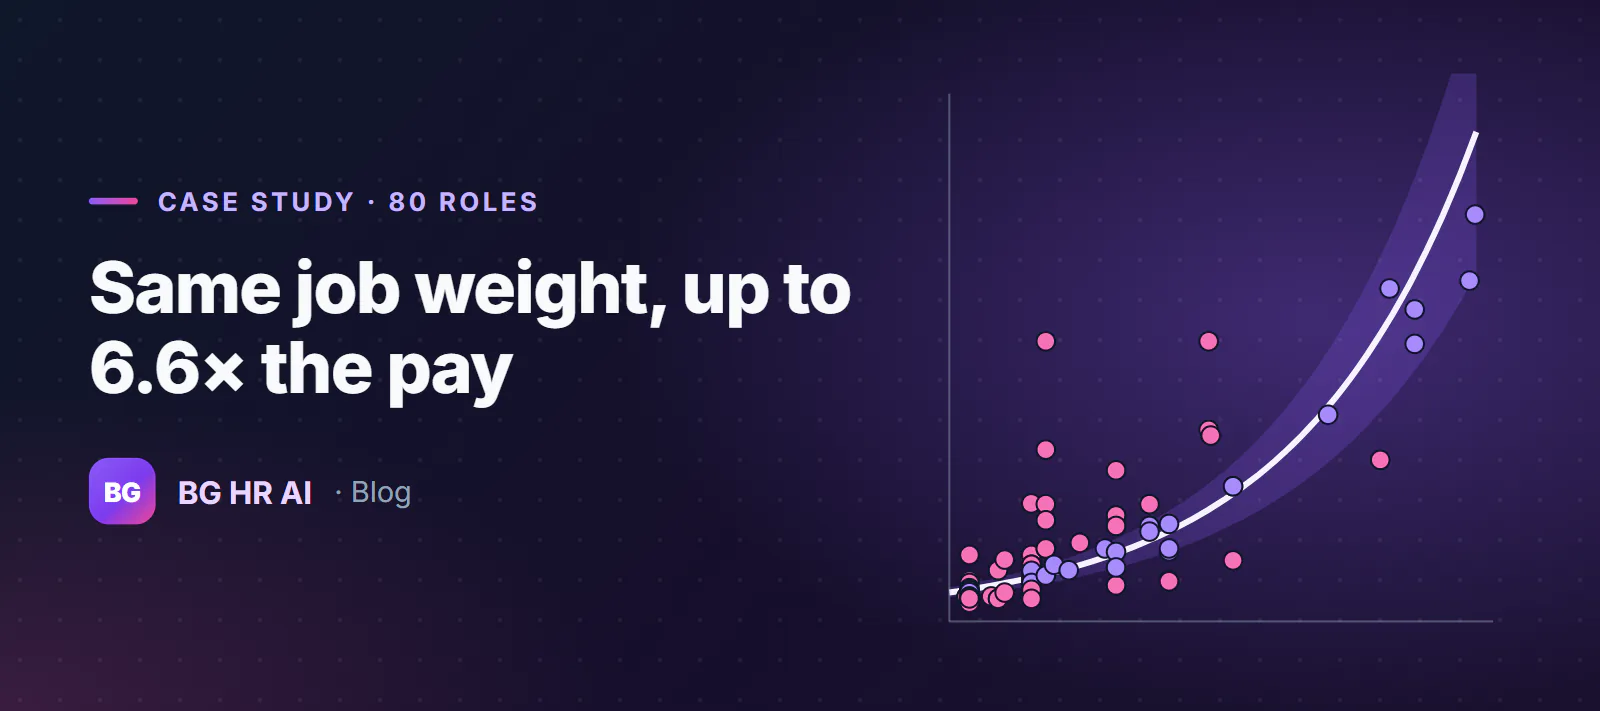
Why We're Publishing This
Over the past cycles, BG HR AI's methodology has been applied in real compensation and job evaluation engagements across eight organizations, spanning manufacturing, retail, automotive after-sales, business process outsourcing, food production, and hospitality. Every one of those clients asked to remain confidential — which is normal and expected for compensation work. This case study respects that: every company name, individual salary, and role-to-pay mapping that could identify a person or an employer has been removed. What remains is the aggregate, statistical evidence of what the methodology actually found, because that evidence is, on its own, worth showing.
The most data-rich of the eight is a manufacturing employer operating in Morocco, where we job-evaluated 80 roles (55 distinct job titles) — from production operators and warehouse staff to quality control specialists, engineering supervisors, and department heads — and cross-referenced every BG Job Evaluation Score against actual net compensation.
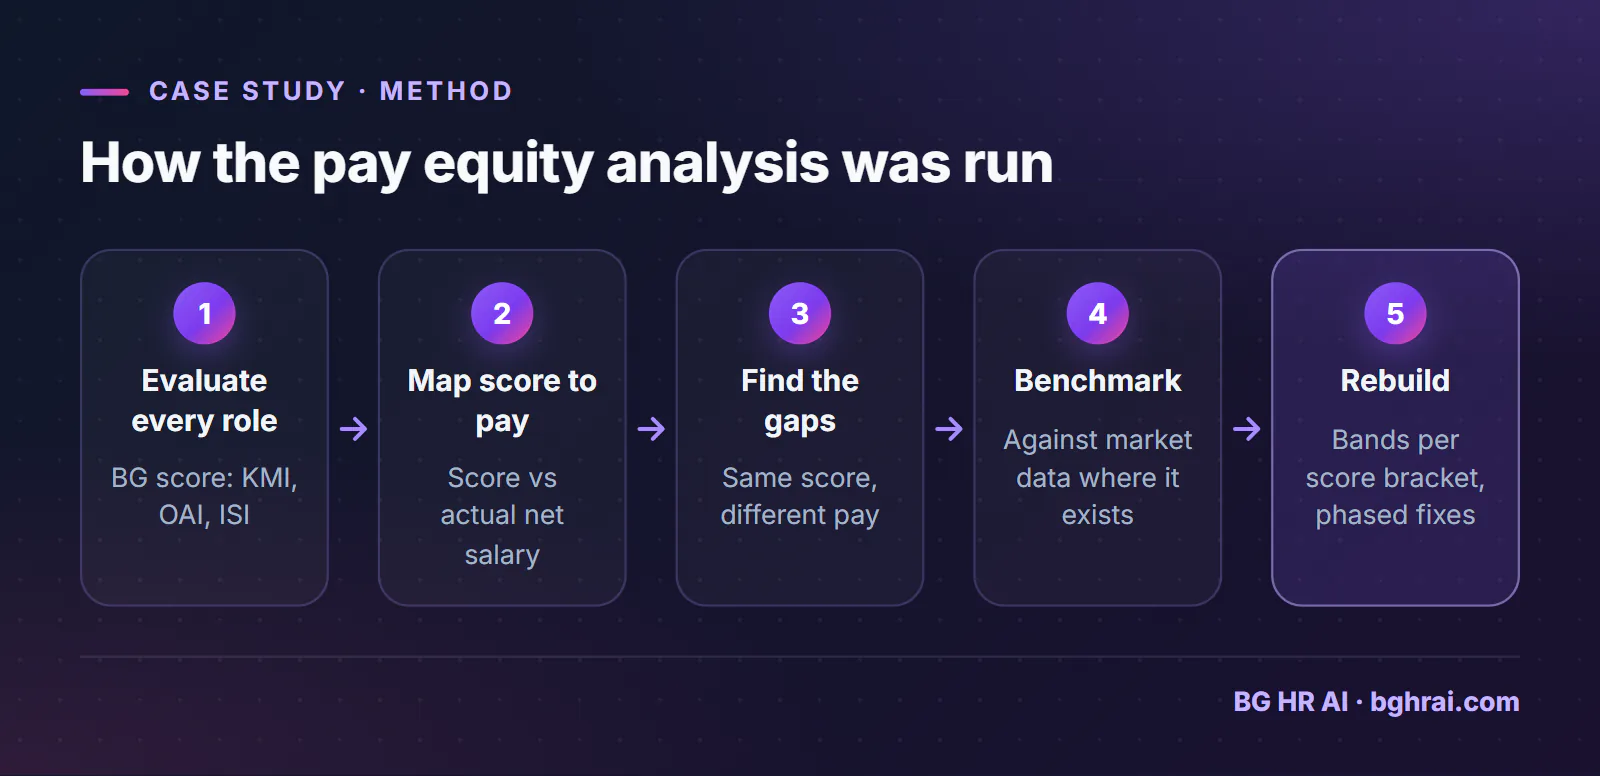
What Compensation Strategy Actually Requires
A compensation strategy engagement generally rests on three pillars, and the BG methodology is built to support each one:
- Job evaluation — scoring every role on a consistent, defensible scale (BG's Knowledge Mastery Index, Operational Autonomy Index, and Impact Scope Index) so that two roles with the same score represent genuinely comparable levels of complexity, autonomy, and organizational impact.
- Internal equity analysis — checking whether people doing work of equivalent evaluated complexity are actually paid within a coherent range of each other, regardless of department, tenure, or historical negotiation.
- Market competitiveness benchmarking — where a market compensation survey is available for the relevant sector and geography, comparing the evaluated internal bands against external market data to test whether pay is competitive enough to attract and retain talent.
The case study below is a clear illustration of the first two pillars in action. Market benchmarking is the natural next step once a market data source is available, and we've applied it in parallel engagements — but what makes this particular case worth publishing is what the internal-equity analysis alone surfaced.
The Finding: Same Score, Very Different Pay
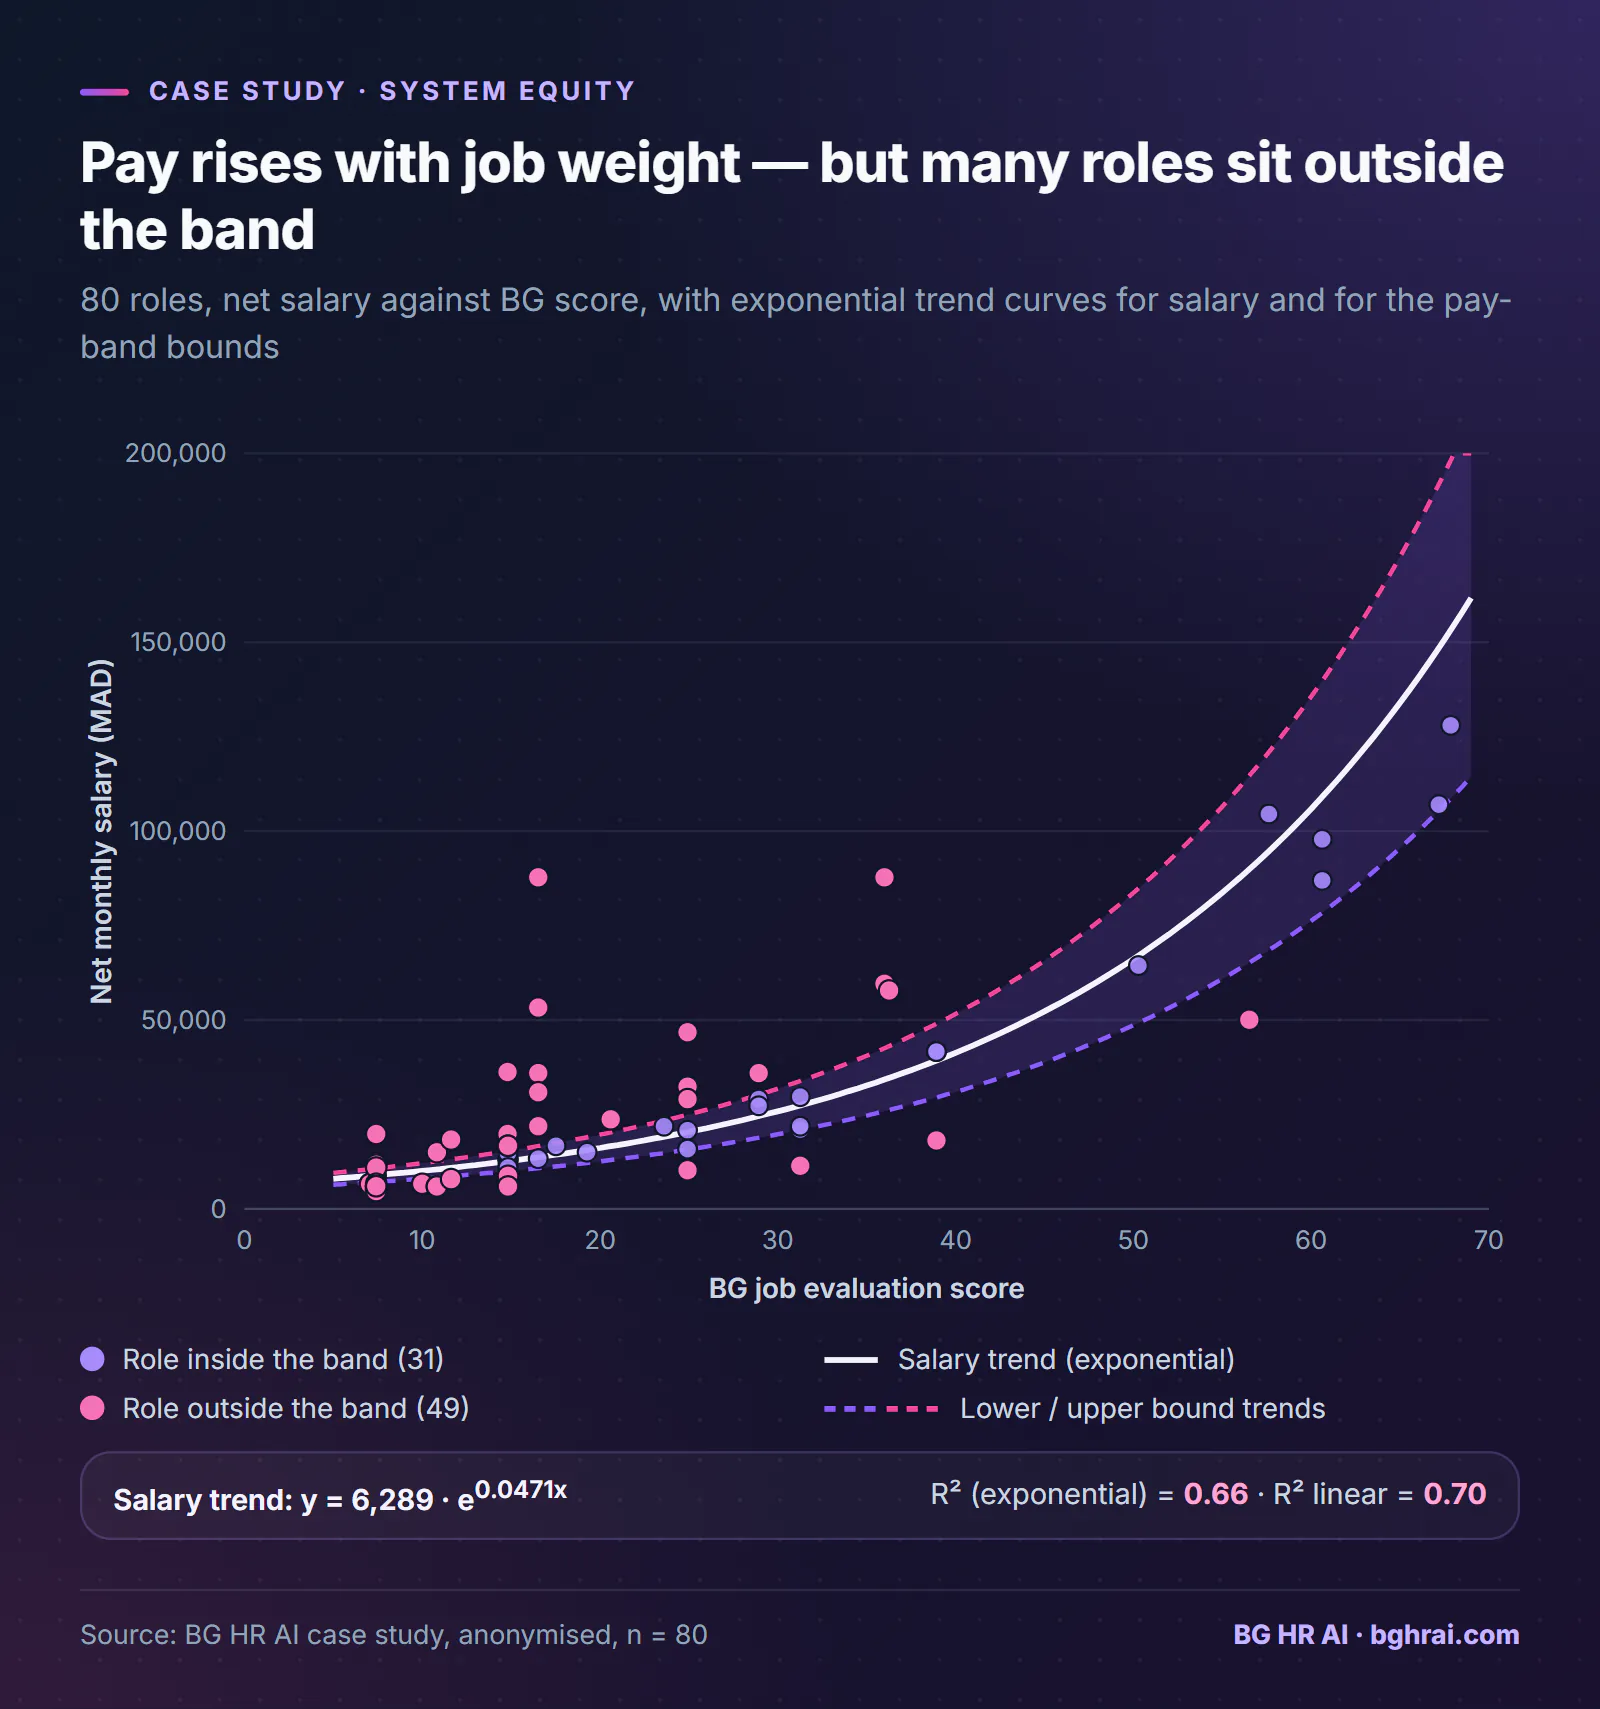
For each of the 80 evaluated roles, we plotted the BG Job Evaluation Score against actual net monthly salary. Across the full sample, the two track each other closely — a correlation of r² = 0.70, meaning job complexity as measured by the BG methodology explains roughly 70% of the variation in pay. That is a healthy baseline: broadly, more complex, higher-impact roles are paid more. The chart below also draws exponential trend lines for salary and for the lower and upper pay-band bounds: 49 of the 80 roles fall outside the band they form.
But averages hide the cases that matter most. When we grouped roles by *identical* BG Score — meaning the methodology judged them to require the same level of knowledge, autonomy, and impact — the pay dispersion inside several of those groups was far wider than any internal equity policy should tolerate:
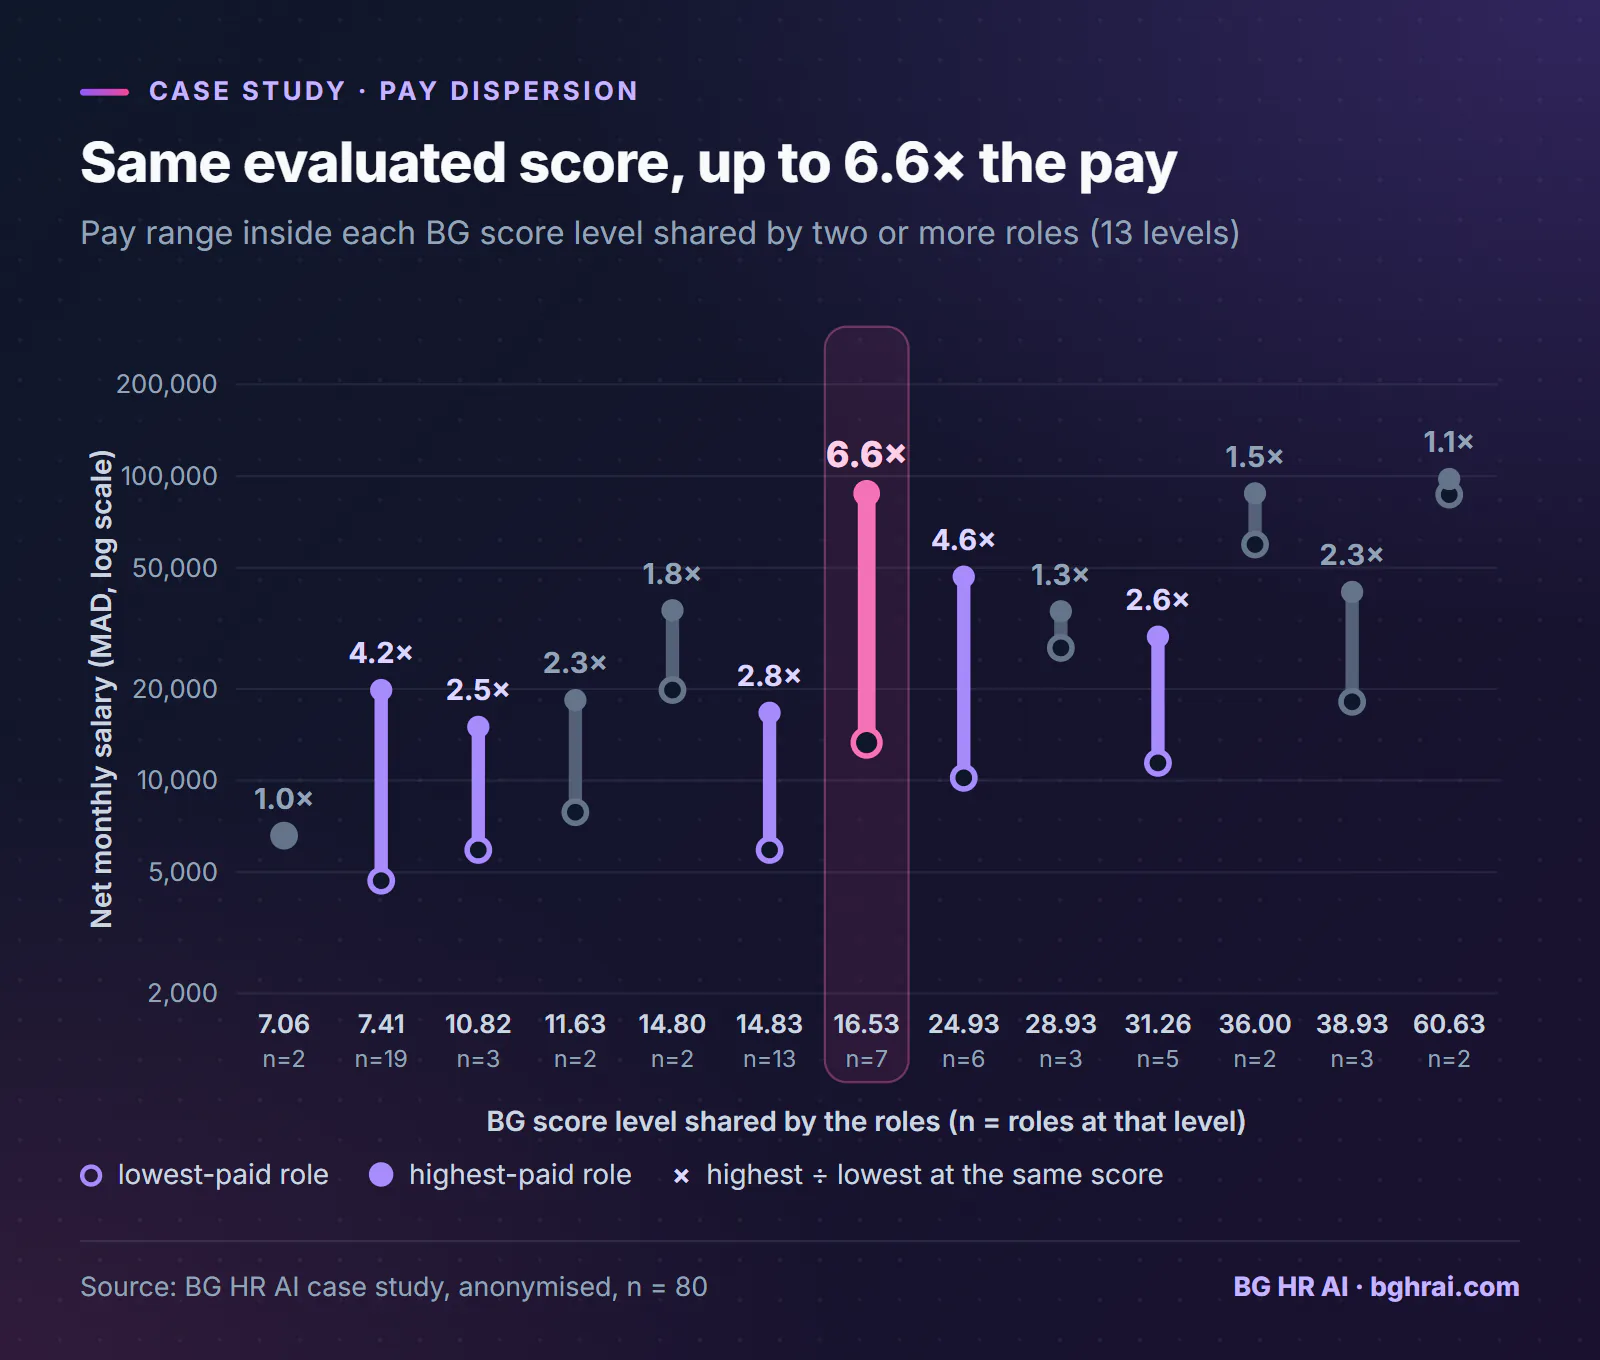
At one score level, the highest-paid role earned 6.6 times the lowest-paid role — despite both being evaluated as equivalent in complexity, autonomy, and organizational impact. At several other score levels, the spread was still 2.5x to 4.6x. Only a handful of small groups (two or three roles each) stayed within a tight, defensible range of 1.5x or less.
This is exactly the kind of gap that is invisible without a structured, score-based evaluation. From the org chart alone, two roles with different titles in different departments look unrelated. It is only once they are placed on the same objective scale that the disparity becomes visible — and quantifiable.
Why This Happens (and Why It's Common)
Pay dispersion at equal evaluated complexity is rarely the result of one bad decision. It accumulates from years of individually reasonable ones: a role created under budget pressure and given a lower starting salary; a hire negotiated above band because the market was tight that quarter; a legacy pay scale from a department that was later absorbed into another; a promotion that changed title and duties but not compensation quickly enough. None of these are unusual. What's unusual is having a consistent enough evaluation scale to actually see the pattern across all of them at once.
This is also why internal equity analysis is inseparable from job evaluation methodology. A compensation audit built on job titles or manager judgment alone can't detect this, because it has no independent, consistent yardstick for "equivalent work." A BG Score can.
From Diagnosis to Compensation Strategy
Identifying the gap is the diagnostic half of the work. Building the compensation strategy from it involves:
- Setting salary bands per score bracket, wide enough to accommodate legitimate factors (experience, performance, scarcity of the skill) but narrow enough to make an outlier like the 6.6x case visible and correctable going forward.
- Prioritizing corrections, since most organizations cannot — and should not — flatten every gap in one compensation cycle. The BG Score gives a defensible basis for sequencing: which roles are furthest below their band, and which carry the highest retention or fairness risk.
- Benchmarking against the external market wherever survey data for the sector and geography exists, so that the internal bands being built are not just internally consistent but externally competitive.
- Making the logic explainable, to managers and to employees who ask why their pay sits where it does. A band tied to an objective, documented evaluation score is defensible in a way that "that's what was negotiated at the time" is not.
Validated Across Very Different Industries
This manufacturing case is the most data-dense of the eight engagements where this methodology has been applied, but it is not an isolated result. The same job evaluation and equity-analysis approach has been used, independently, across:
- Organized retail and field sales networks (FMCG)
- Automotive dealership after-sales operations
- Supermarket and organized retail chains (two separate engagements)
- Business process outsourcing / customer service centers
- Dairy and food manufacturing
- Hospitality (hotel operations and food service)
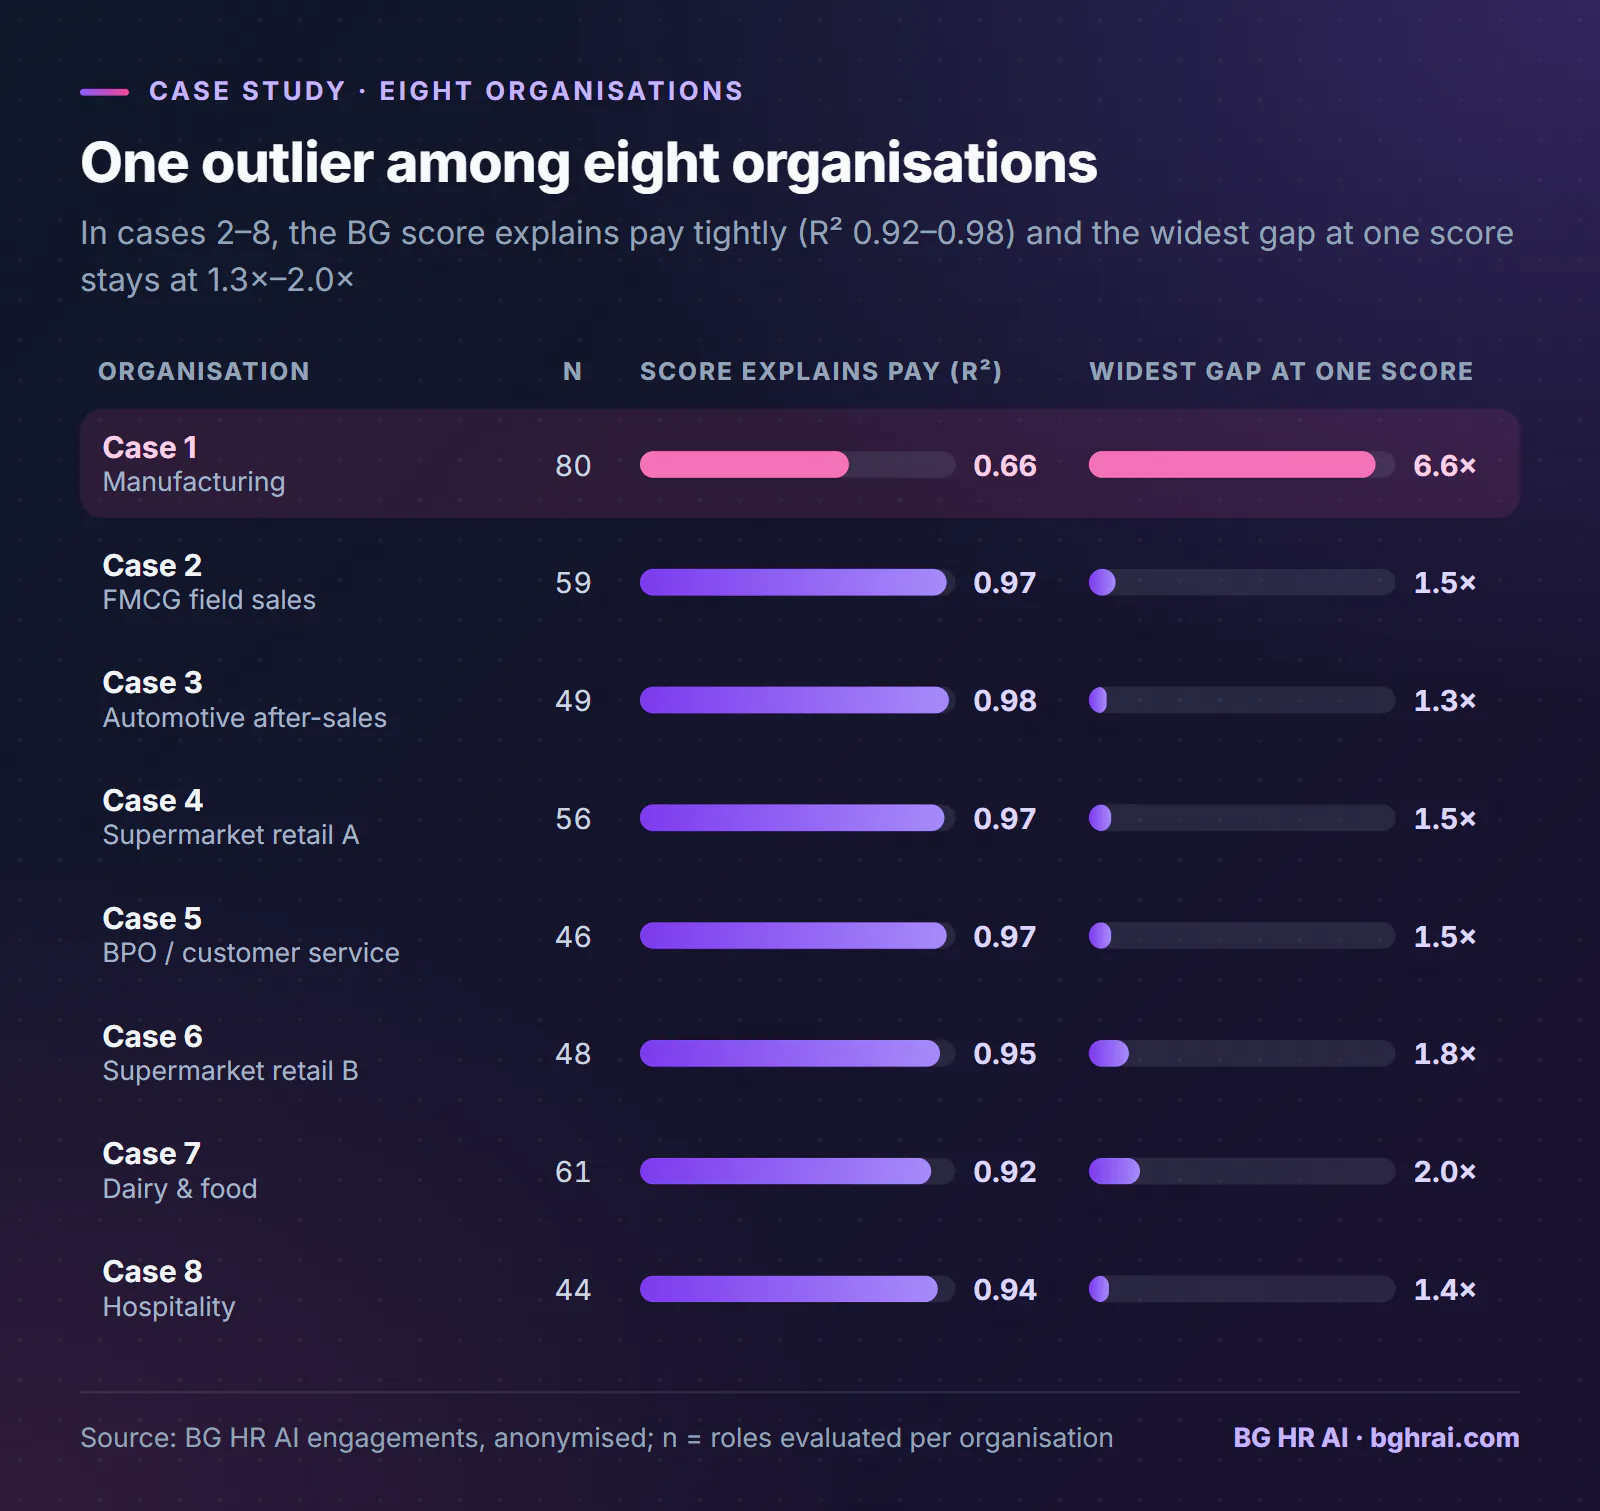
The contrast is the point. In the seven other organisations, the BG score explained pay far more tightly (exponential R² between 0.92 and 0.98), and the widest gap between two roles at the same score stayed between 1.3x and 2.0x. Equal evaluated weight, broadly equal pay: that is what a coherent pay system looks like, and it is what makes the 6.6x manufacturing case stand out.
Across sectors this different — from a call center floor to a hotel back-of-house to a pharmaceutical production line — the same underlying question keeps coming up, and the same method keeps being able to answer it: are we paying for the actual complexity and impact of the work, consistently, across the whole organization?
The Privacy Commitment
Every one of these case studies was conducted for a client that chose to remain anonymous, and that choice is respected here as a matter of professional practice, not just courtesy. Nothing in this article — or in any case study BG HR AI publishes — identifies a company, a named role holder, or an individual's compensation. The charts above show aggregate score-vs-pay relationships and score-bucket statistics only; no single employee's data can be reconstructed from them. That is the same standard we apply to every compensation engagement we run: the analysis has to be rigorous enough to change decisions, and private enough that no one conducting it needs to worry about what it exposes.
If your organization suspects it has pay equity gaps it can't currently see — because it doesn't have a consistent way to compare roles across departments — that is precisely the blind spot a structured job evaluation is built to remove.